In this blog post, I share how the dedicated workbooks could look like regarding their content.
Note: During the analysis of a specific high-severity security incident in a customer environment you might want to display specific content on the SOC wall screen.
Link to other Parts:
- Planning the Setup
- Develop your Video Wall Application
- Build your Content
Display 1 – Ingestion volume (EPS) monitoring
On Display 1 we want to monitor the overall event data received per hour by type. This allows us to identify anomalies although all customer workspaces are included in the query.
union withsource = _TableName *
| where _TimeReceived > startofday(ago(2d))
| summarize count()  by bin(_TimeReceived, 1h), Type
| order by count_ asc
| project Type, _TimeReceived, count_
In the lower part of the display, we visualize the total EPS (events per second – average, max and min values) per table and across all workspaces. Usually, MDE device event data should be on top of the list.
union withsource=_TableName *
| where _TimeReceived > ago(24h)
| summarize count() , Size = sum(_BilledSize) by bin(_TimeReceived, 1m), Type, _IsBillable
| extend counttemp =count_ / 60
| summarize
           ['Average Events per Second (eps)'] = avg(counttemp), ['Minimum eps']=min (counttemp),
           ['Maximum eps']=max(counttemp)
  by ['Table Name']=Type
| order  by ['Average Events per Second (eps)'] desc
Display 2 – security incidents information
In the upper area on display 2 we show the number of security incidents created per hour and the sum of the past 24h. This information allows us to identify “busy” hours at our customers.
We filter out customer security incidents which might be out of scope of the agreement directly in the query.
SecurityIncident
| where CreatedTime > ago(24h)
| summarize arg_min(TimeGenerated,*) by IncidentNumber, TenantId
| where Labels !contains "bVSOC-OutOfScope"
| summarize count() by bin(CreatedTime,1h)
The second information shown on this display are the numbers of currently Active security incidents from the past 30 days. A lookback of 30 days corresponds with the schedule of the monthly SOC reporting we provide our customers.
SecurityIncident
| where CreatedTime > ago(30d)
| summarize arg_max(TimeGenerated,*) by IncidentNumber, TenantId
| where Status != "Closed" and Status != "New" and Labels !contains "bVSOC-OutOfScope"
| summarize count() by Severity
The last information we show on this display are the numbers of currently New security incidents. This helps us to identify any New security incidents whose status was not updated from the change in the Microsoft Sentinel UI queue. We’ve experienced situations where the status update in Microsoft Sentinel has not been reflected in the log analytic workspace.
SecurityIncident
| where CreatedTime > ago(30d)
| summarize arg_max(TimeGenerated,*) by IncidentNumber, TenantId
| where Status != "Closed" and Status != "Active" and Labels !contains "bVSOC-OutOfScope"
| summarize count() by Severity
Display 3 – Medium/High security incidents information
This display shows all the security incidents visualized by status, incident title and closing classification from the past 24 hours. This helps us to visually identify high/medium security incidents including all status.
SecurityIncident
| where TimeGenerated > ago(24h)
| summarize arg_max(TimeGenerated, *) by IncidentNumber, TenantId
| where Severity == "High" and Labels !contains "bVSOC-OutOfScope"
| summarize count() by Status / Title / ClassificationReasonDisplay 4 – Twitter!
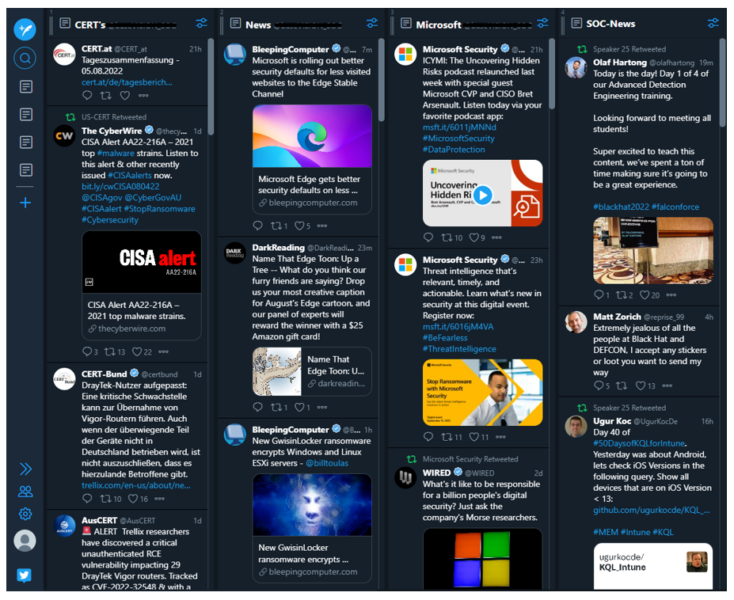
The last display accesses Twitter information with a dedicated user and via Tweetdeck (TweetDeck (twitter.com)). The user has configured lists which are displayed in four columns on the display. This allows us to stay up to date and catch important information while working.
- Sentinel Automation use case – custom Alerting with LogicApps - March 6, 2023
- Microsoft Sentinel Security Incident statistics with Workbooks - February 20, 2023
- Sentinel Incident Automation – Playbook dependencies - January 16, 2023


1 Comment
SOC Monitor wall – Planning the Setup (Part 1) - Workplace Ninja's · September 1, 2022 at 07:40
[…] Build your Content […]